
Gas-responsive nanoparticle shape: exploring facets, adsorption and the support
Change the gas and compare a nanoparticle's 3D shape with its TEM projection. Explore facet-selective adsorption, adhesion to the support and the delay between a gas switch and a shape change.
A particle’s shape is part of its response
A supported catalyst nanoparticle can expose different facets as its environment changes. Adsorption changes the relative energies of its surfaces, while adhesion to the support affects how much the particle spreads. In a TEM image, these changes appear as a changing outline—but an outline alone does not tell us which contribution has changed.
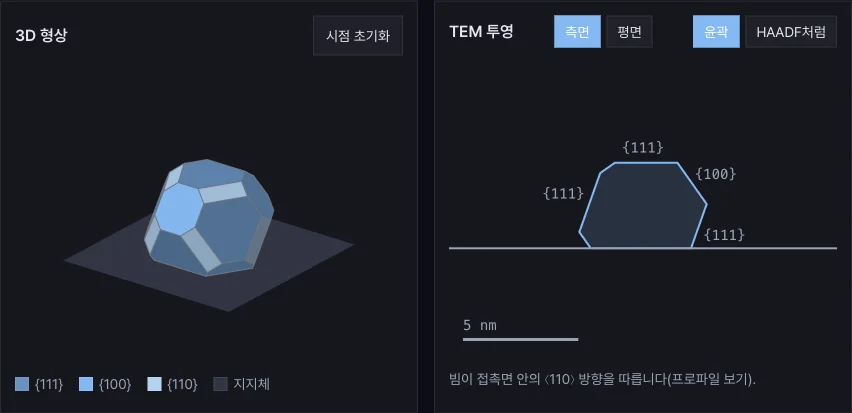
AEML’s second research tool, Gas-responsive nanoparticle shape, makes these connections visible. Switch the gas, rotate the 3D particle and compare it with a TEM projection. Facet area shares and the height-to-width ratio update alongside the images, helping connect a visual change to a structural description.
Start with three contrasting examples
The example buttons change several parameters together to illustrate different responses. Try them before adjusting individual controls.
- H₂O added → rounder: compare the particle before, during and after a gas pulse. Watch the changing shares of the {111}, {100} and {110} facets.
- CO added → spreads on support: examine how a gas-dependent change in adhesion affects the particle’s height and footprint. Compare this with changing adsorption on the free surfaces.
- Facet-selective pulse: cube ↔ octahedron: explore how stronger adsorption on one facet family changes the balance between shapes. This example uses a free particle, making the facet competition easier to see.
The gas names label illustrative scenarios. The parameters are chosen to show the effects clearly; they are not fitted predictions for a particular metal–gas combination.
Separate gas arrival from shape relaxation
A valve command and the environment at the particle need not change at the same instant. The tool uses the same delayed gas-response model as the Gas TEM planner, then adds a separate relaxation time for the shape response.
Use the time slider to follow a pulse from arrival to recovery. Increasing the shape relaxation time produces a larger delay between the changing gas environment and the modeled shape. The plot of gas composition and facet areas helps distinguish these two timescales. The Away from equilibrium readout compares the current facet area shares with those of the instantaneous equilibrium shape.
This is a useful way to frame an in situ observation: is a particle still responding to an earlier environment, or has its shape caught up with the current one?
Compare a 3D structure with what TEM shows
Drag the 3D view or use the arrow keys to change the viewing angle. Switch the projection between side and plan views, then compare an outline with the HAADF-like rendering. Seeing the same structure in more than one view helps identify changes that may be difficult to distinguish in a single projection.
The projection is computed from the geometry. Its HAADF-like appearance represents projected thickness; diffraction, composition-dependent scattering and microscope transfer functions are outside this model. Use it to explore the relationship between shape and image contrast.
For a controlled comparison, change one input at a time: gas composition, pressure, temperature, adhesion or shape relaxation time. Copy settings link preserves the inputs so that a colleague can open the same example. Calculations run in the browser.
From an interactive picture to a research question
The model combines Langmuir adsorption with the Wulff construction for a free FCC particle and the Winterbottom construction for a supported particle. It keeps the particle volume fixed and represents shape relaxation with one timescale. These choices make the effects of surface energies and adhesion easy to compare.
Real particles may also reconstruct, change phase, oxidize, lose material or become trapped in metastable structures. The tool provides a starting point for discussing which measurements would help distinguish those possibilities. The equations, parameter meanings and references are available in Model & assumptions below the interactive view.
How we built and checked the tool
We designed and implemented this tool with Claude Opus 5.5 Max in Claude Code. Starting from an AEML research question—how does a changing gas environment affect particle shape?—we defined the model and its scope, then built the calculations, 3D view and TEM projection in TypeScript, React, SVG and Canvas.
The calculation code and tests were reviewed independently with Codex (GPT-6.1 Sol, Max), and the findings informed revisions. Checks covered reference shapes such as cubes and octahedra, volume conservation, facet area shares and the time response. We also compared polyhedron volumes and surface areas with independent SciPy geometry calculations, and checked the controls on desktop and mobile in both languages.
Open the tool and compare the three examples →
For another view of catalyst evolution, try our catalyst sintering detective to follow particle growth, migration and coalescence.